

The purpose of this article to teach traders how to open trades based on my experience and how I sort it based on risks.
Basic Introduction for Newcomers
Price go up = Bulllish
Price go down = Bearish
We can measure the momentum of these price with a term we call bullish momentum and bearish momentum. You will hear it a lot on this article.
As this article is for understanding setups and making decisions, the basic term you need to understand is
Support and Resistance

In a market, I would like to classify a support is a price where the majority of the market agree that the price is worth that much, resistance where the price is too expensive, and the between is "meh" price. The usual thing is that price moves between that point like a horizontal channel. However, there's some time where a breakout occur or a resistance is passed and now the market sets a new standard for the asset. In which resistance could turn into a support.
Patterns
Patterns are recognizable well– pattern. That is backed by market sentiment to predict where the price go and when you should enter a trade. That's where I would help you in this article.
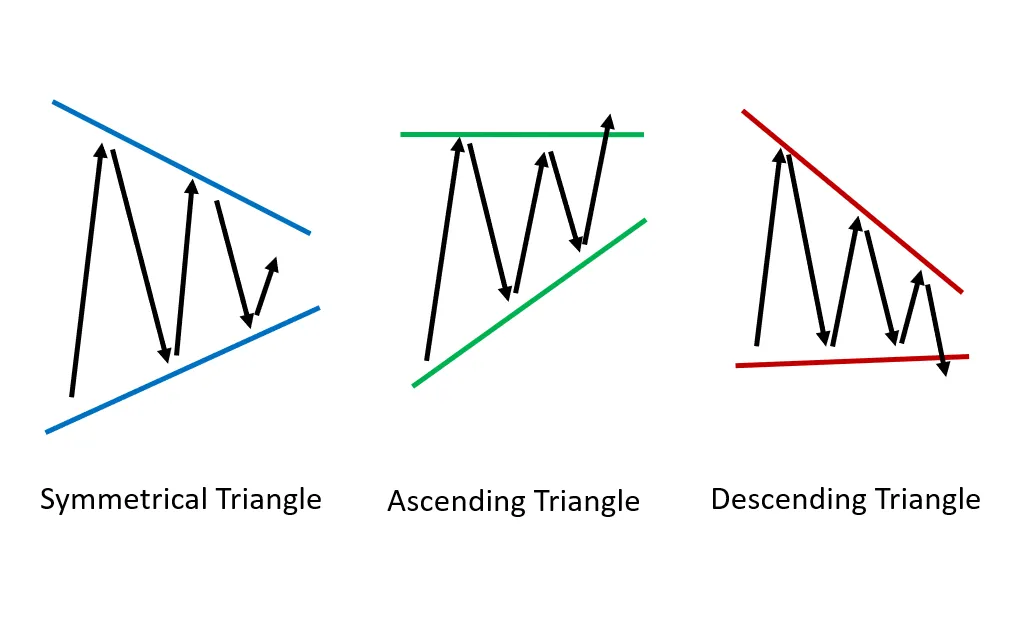
Usually ascending and descending triangle is the pattern you will see the most or make the most. It's important because it summarizes these terms
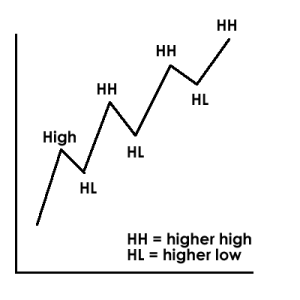
Higher Lows and Higher Highs: Bullish
Higher lows: Bullish, this mean the low price is being dragged up over time, the market agrees on a higher new standard of the asset.
Higher Highs: Bullish, this mean that the asset is consistently climbing a higher price that the market agrees its worth.
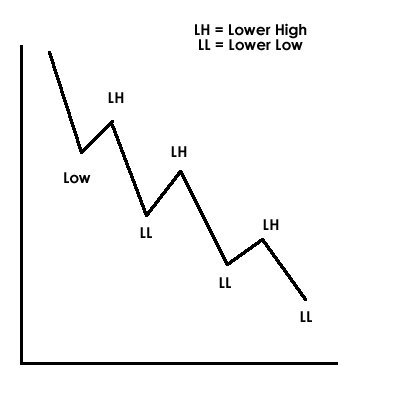
Lower High and Lower Low: Bearish
Lower high: the price consistently moving to a lower high means that the market changes their mind of the worth of the asset and cant keep the price as expensive as before
Lower low: even buyers are starting to lose trust on the asset and less and less buyers are buying when it drops making a consistent lower low.
Going back to the triangle charts. Check the ascending triangle, it has consistent higher low and the more narrow it becomes to the resistance the more likely it would break and do a price discovery.
The descending in the other hand, shows a consistent lower highs that infer the market feels the price is not worth being as high as before and the more narrow the more it leads to price to plummet from the support.
Those are just a basic understanding and pairing those analysis with the market sentiment is a must for making a decision, that's where I will help you with.
First, most important, is BTC Safe?
The most important parameter you cannot dismiss. If no, then don’t force to make a trade. If you already know that is not safe, be patient, this could last for days this is a medium to high-risk zone. Especially if the setup is prone for BTC to have a sudden drop, this could be shown on a bearish wave, bearish descending triangle, consolidation around resistance, etc.
This picture below is the current situation for BTC, a visible descending triangle, so It's not a good time to open trades because the market generally follow bitcoin. There's a thing called bitcoin super-cycle but that's a long story. What you need to know is only, if BTC looking like it's about to fall or in a bearish movement. The market has a bigger probability going down than up. So use that information wisely
If BTC is on a bullish movement however, then BTC and other alts has more probability of going up than down, so that's a good signal to enter the market.

Know your setup
I generally put a trading setup into three categories.
- Low Risk: Buying the dip, longing at support, longing for long term golden cross
- Medium Risk: Buying at retest, buying at consolidation
- High Risk: Longing resistance
1. Low Risk
Longing Support
The reason on how I made this call, is first I identify the bullish uptrend and made the fib channel. That way I know, on the uptrend, the strong uptrend support for me to accumulate and the overbought resistance for me to take my profits. This is a relatively low-risk trade if you identify the support correctly.
This is a relatively safe trade because if you buy a dip, the price has decreased, and the probability of it decreasing more is less. But some people don’t feel safe buying the dip, not realizing it’s actually the lowest risk to make the trade.
One thing you should measure is also how the price rallies in the past and how bullish it is and how support will be appreciated as a pivot point for the coin.


Longing Support & Reversal Point
The reason why I think this is a reversal point, in which I set buys on the orange line. Is because LTC has a bearish movement in the past candles. and support is only somewhat promising. In this case, I put two-set buys to bet the reversal point price.
The reason why I believe there’ll be a reversal is that LTC is generally on a bullish momentum and I don’t see any sign of exhaustion.


Longing Bullish Consolidation Channel
So this trade on XMR is an example of a bullish consolidation, where buyers and sellers agrees on the valid support and resistance. As you can see on the chart below, there's a couple of times when resistance has been hit and denied and support has been replenished as well. Strong measurement to make the fib channels.
It's a low risk trade because there's a likely possibility the price would resonance around that channel like a sine wave. Put a stop loss at the exit of the uptrend that makes the uptrend channel broken.


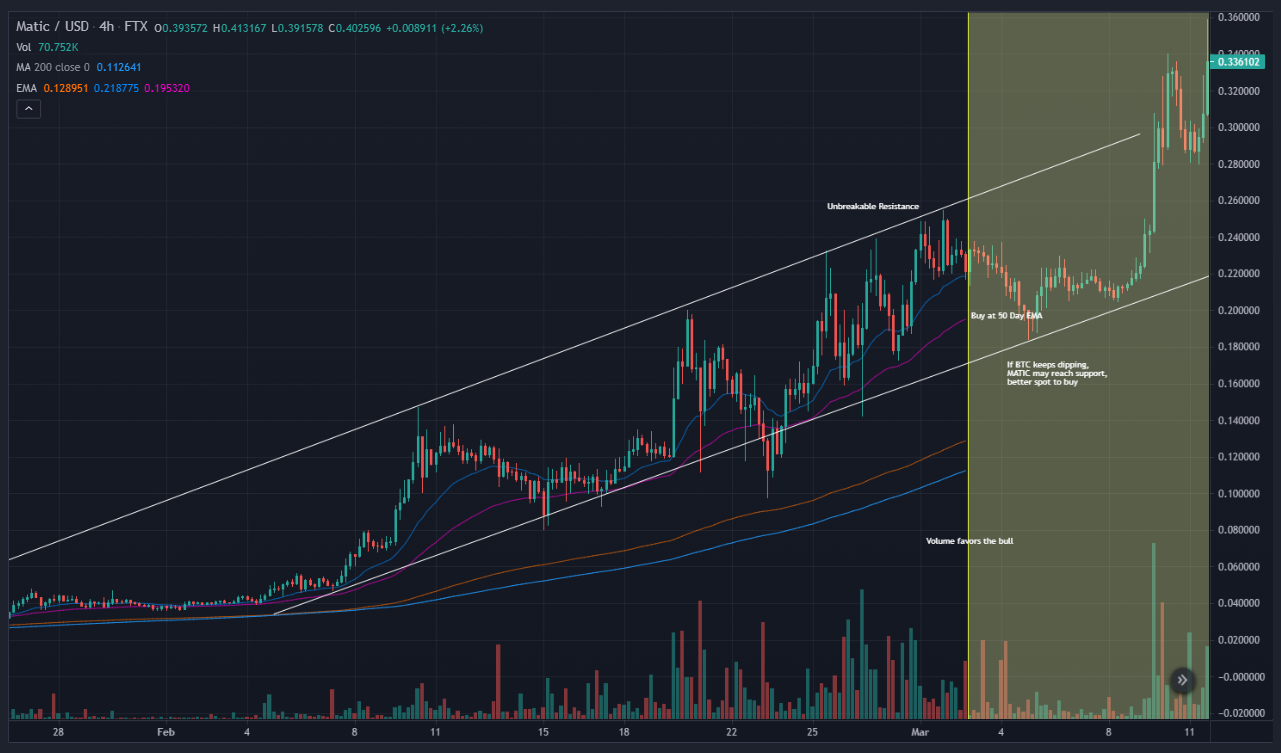
MATIC March 2nd
On this MATIC extremely explosive setup, I take into account the fact that MATIC is on a bullish rally and MA lines are extremely bullish as well, my initial plan was to buy at 50 Day EMA that can act as support and also buy on the support line. This is relatively hard to believe because you never know when it'll drop and if your set buy is right or not, this has some kind of eerie feeling of anxiety to wait. Perhaps, it requires a lot of practice before nailing the setup that you created.
For my case is I saw MATIC is currently exhausted from failing breaking out from an unbreakable resistance that I put the the word on the chart, my reversal point is the white support line but I doubt it'll go there so I mark to buy at 50 Day EMA as well.


BAT Example

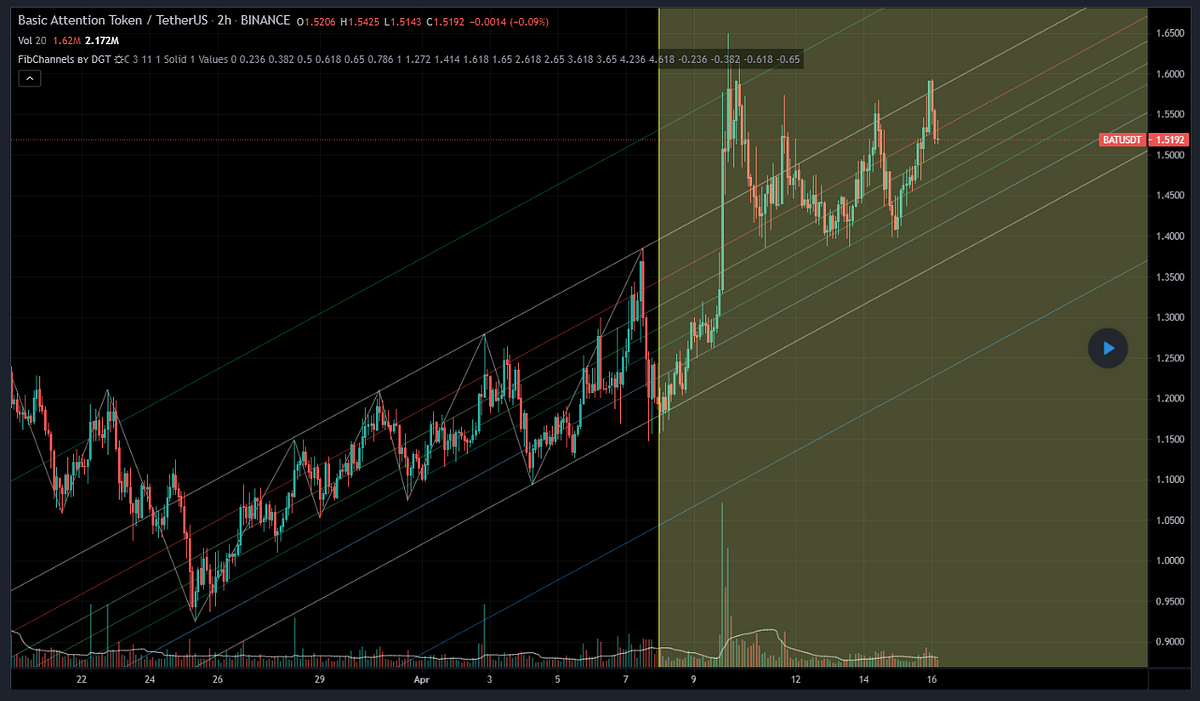
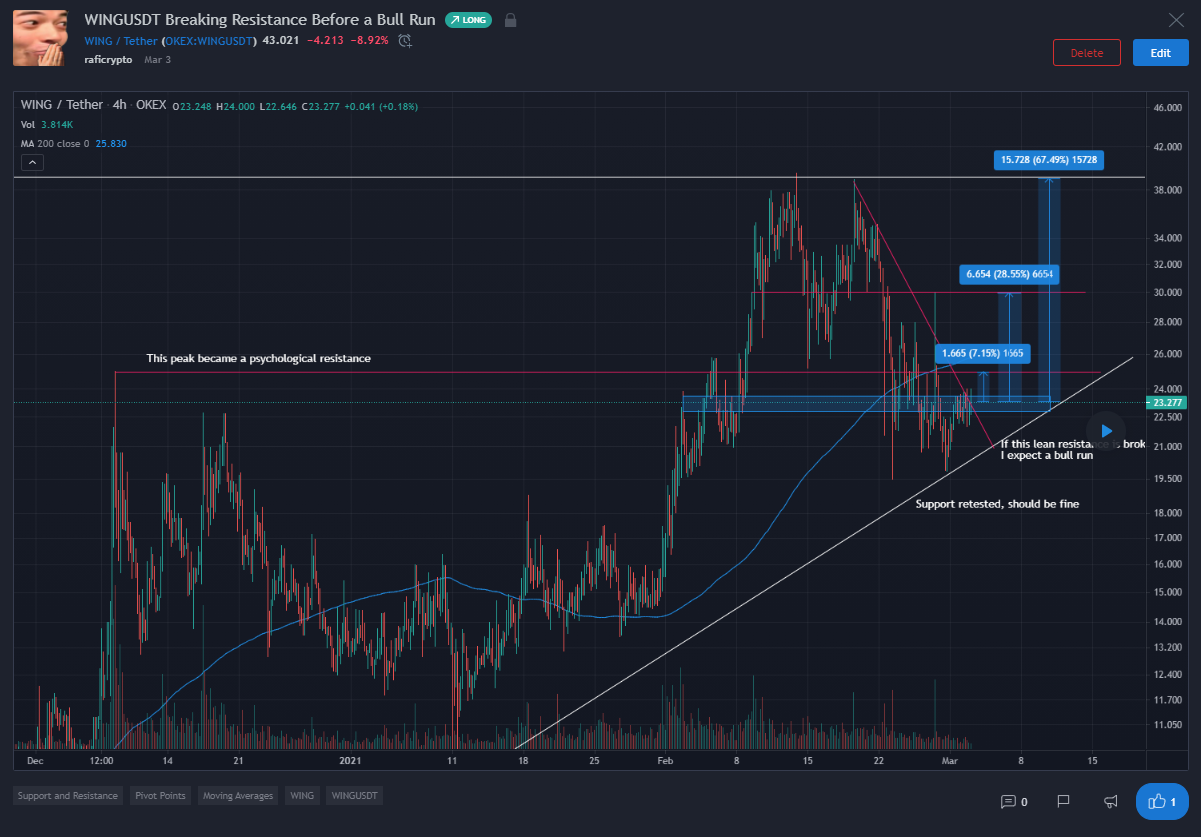
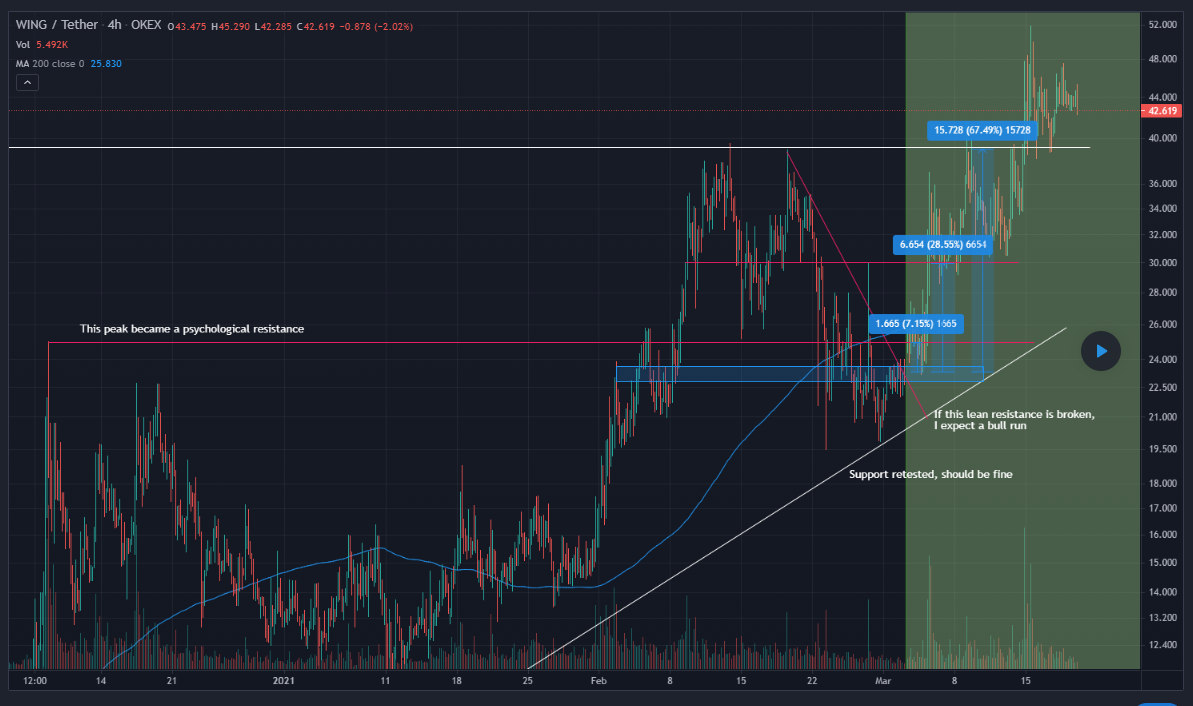
WING March 3rd
So the blue box area, that's what I call a supply zone. You can also see on the chart I put a pyschological resistance, in which a 7% increase from the current price.
Another thing you can see is the bullish momentum that WING has since 11 January on the chart. That's insanely bullish and was rejected at aronud 40 resistance. That's how you can tell its time for another cycle. Its rejected twice and resting on the supply zone.
How do I know that is the supply zone? Because on the previous bull run, it was the place that previously launched from 22.5 to 40. and the zone is revisted again. The result? The exact surge happens!
CKB March 6th
My explanation on the original post was
"Volume has been catching up, support may seem like a reasonable place to buy for the bulls.
Resistance has been tested A LOT OF TIMES.
RSI are getting better and finding a new higher low, I expect a reversal bullish from here"
What's special on this trade, that this is a relatively very safe trade. Because its on an accumulation support zone.
The great thing about the resistance that leads to a massive surge is due on how strong it was.


2. Medium Risk
Buying Retest
This is I think the setup that I use the most, mainly because I can see how bullish the coin was before and determine if the coin is worthy of another fly to the moon, obviously it wouldn’t be always all green on the trip of the moon, there’ll be retest and support validation and that’s when you’ll buy.


OGN April 4th
So it has shown a great bullish reversal power, and currently testing past resistance. The great stuff about longing retest that you can measure how strong the bullish reversal is. I usually bet on the probability it was to be exhausted and drop back down again. So my stop loss would be below the support line or where it shows clear exhaustion on the chart.


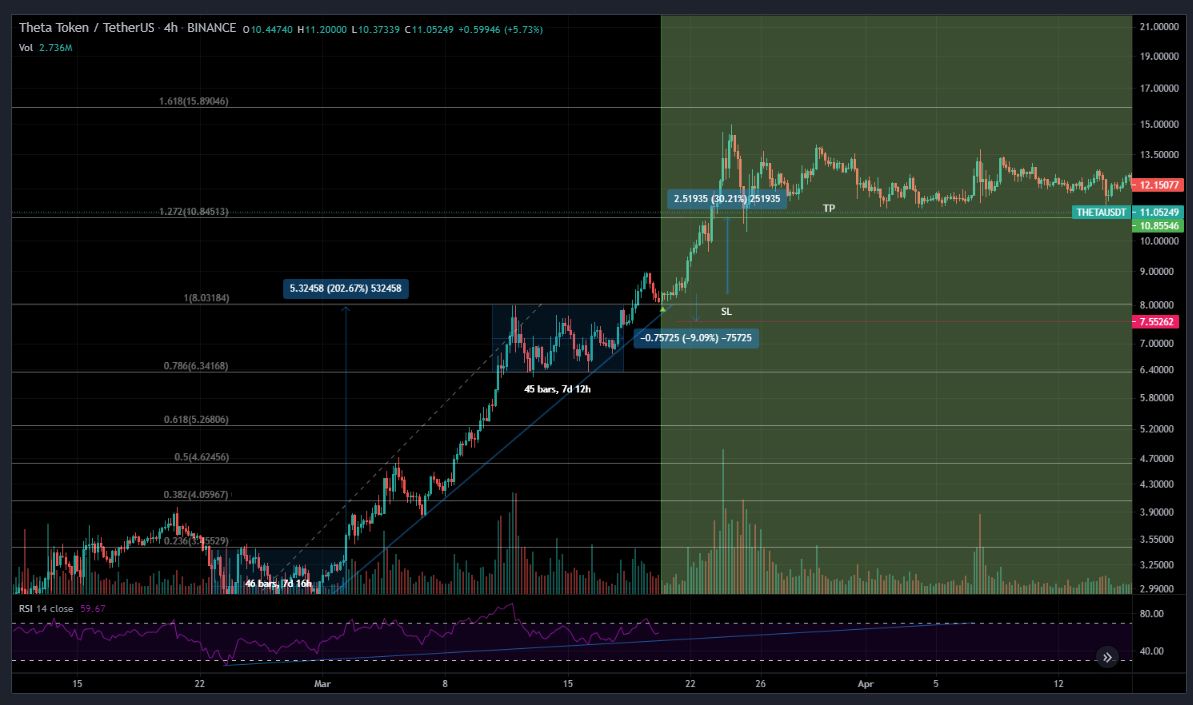
THETA Retest March 20th
So this is a great setup, THETA has recently rallied and been dilligently respect the uptrend blue support line, it broke and it has retested the past resistance. This is an absolute buy. I usually put a 10x leverage as you can see on my SL line is on a 9% tolerance, which suggest if it drops by 9%, I would sell my entire position.
Why that 9% exactly? Because from my point of view, that is the reversal point from a bullish to a consolidation.
THETA previous consolidation channel is on the 7days bar that I draw on the chart, and if it goes there it means they'll be consolidating instead of continuing the rally.

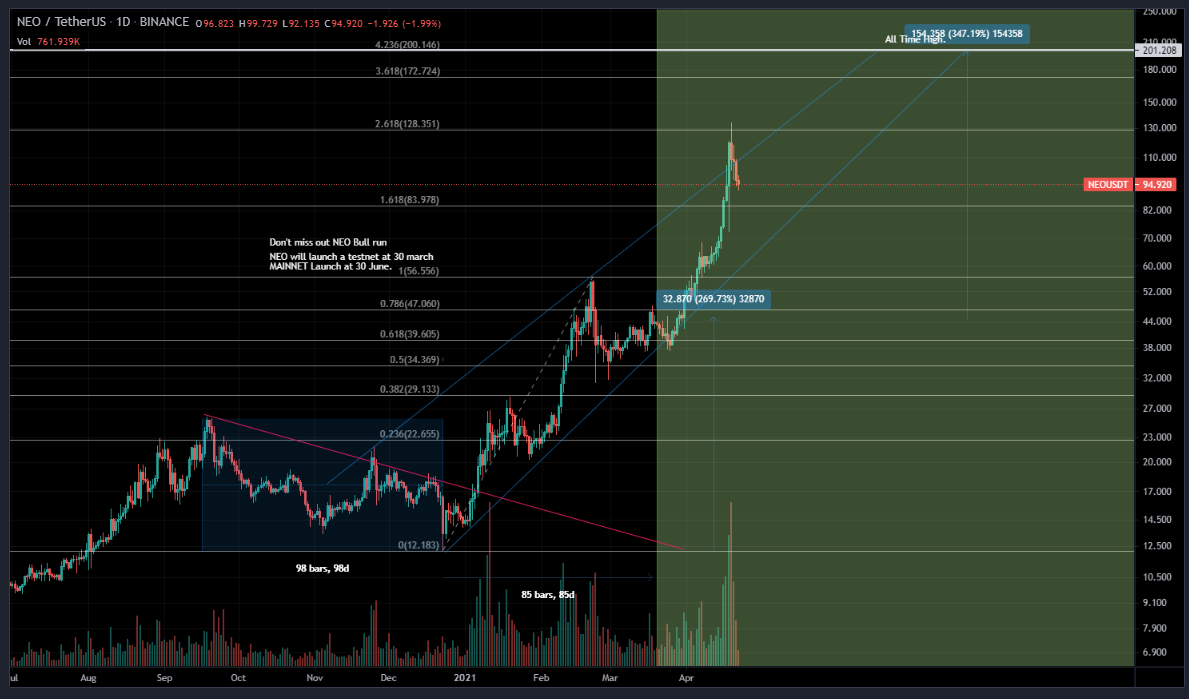
NEO March 19
My explanation on the post was
"Neo has broken off a 98 days bear period and launched to a consistent uptrend that lasts for 85 days. Retracement is mild in my opinion and every coin drops when BTC drop, Fib retracement is still maintained, and the blue support line is respected.
As time goes nearer to the launch I expect a consistent uptrend with just mild retracement, the blue support line may break but not too far away as the overall trend should be maintained bullishly.
See you guys at June with your NEO stacked:)"
NEO recent peak was 120, a 3x from my initial call at March 19.

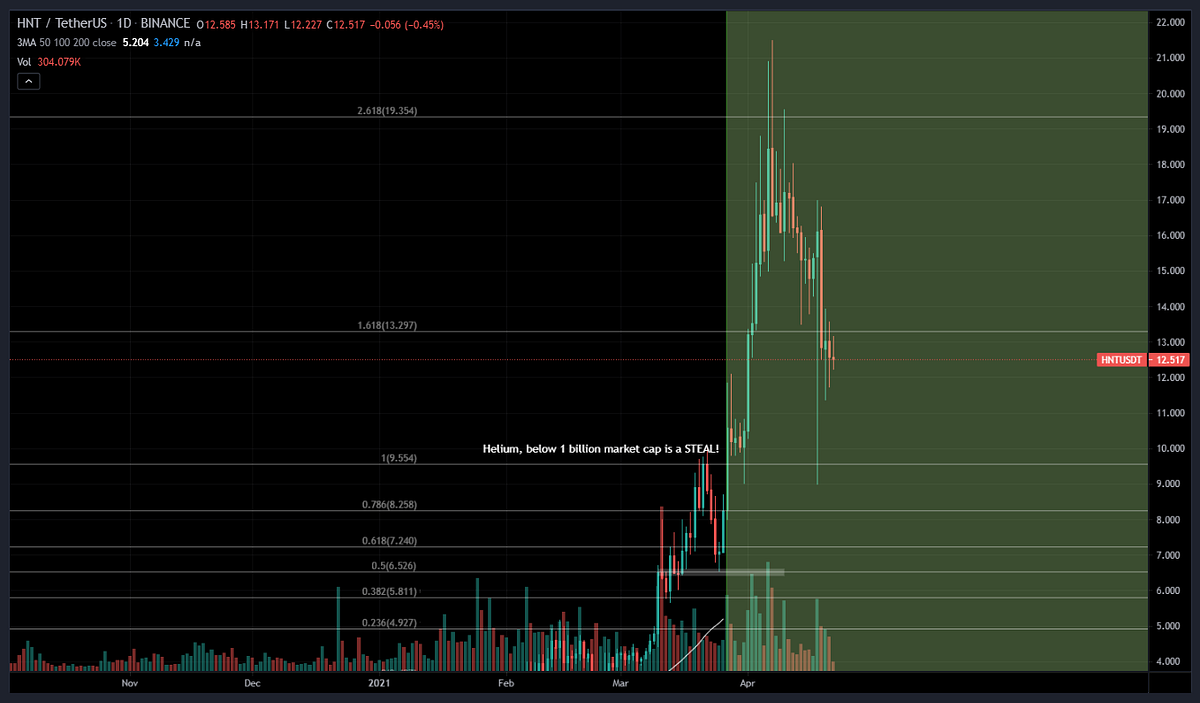
HNT March 27
HNT has bullishly rebounce and is somewhat denied by the resistance, is it a good time to buy or you would wait for it to drop again? The problem with the latter option, if it were to drop again, it would turn from a bullish reversal pattern to consolidation, so that’s the reason why on a bullish retest you should better off jump in the trend knowing its a mid risk but you can put a stop loss below the support zone assuming the trend would break if it goes there.

DATA March 6th


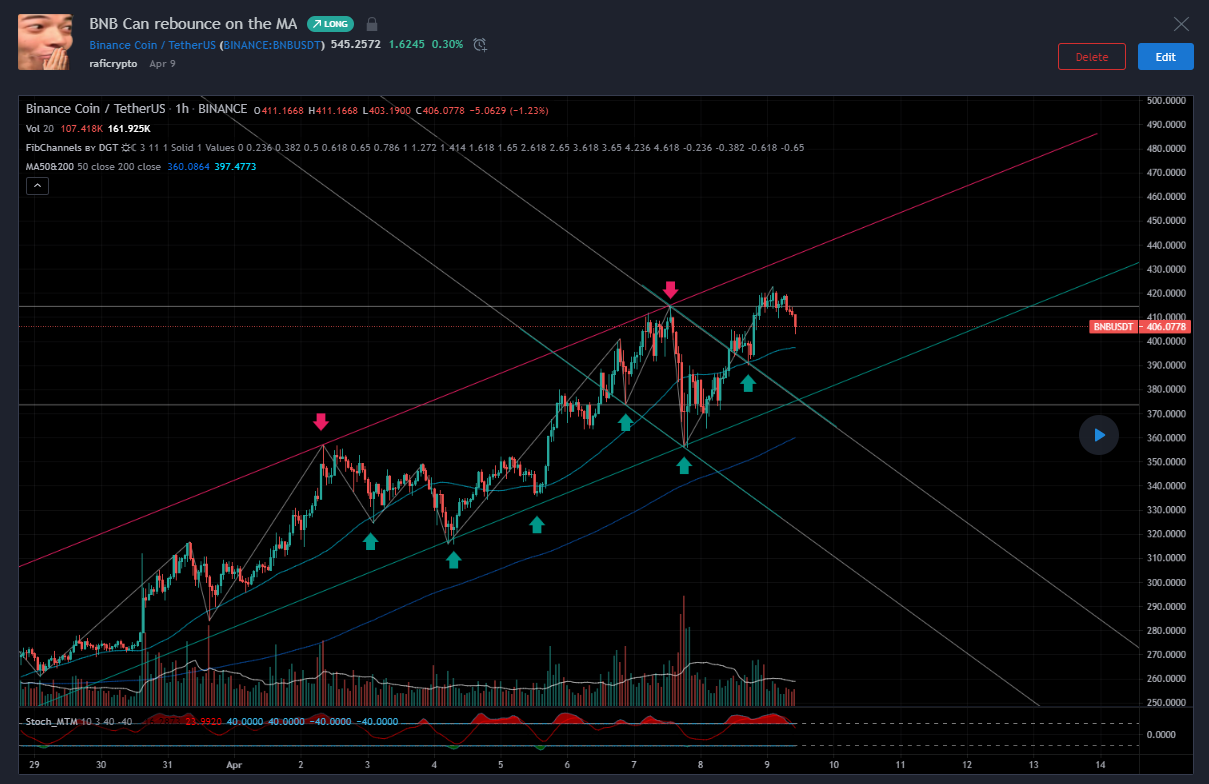
BNB April 9th

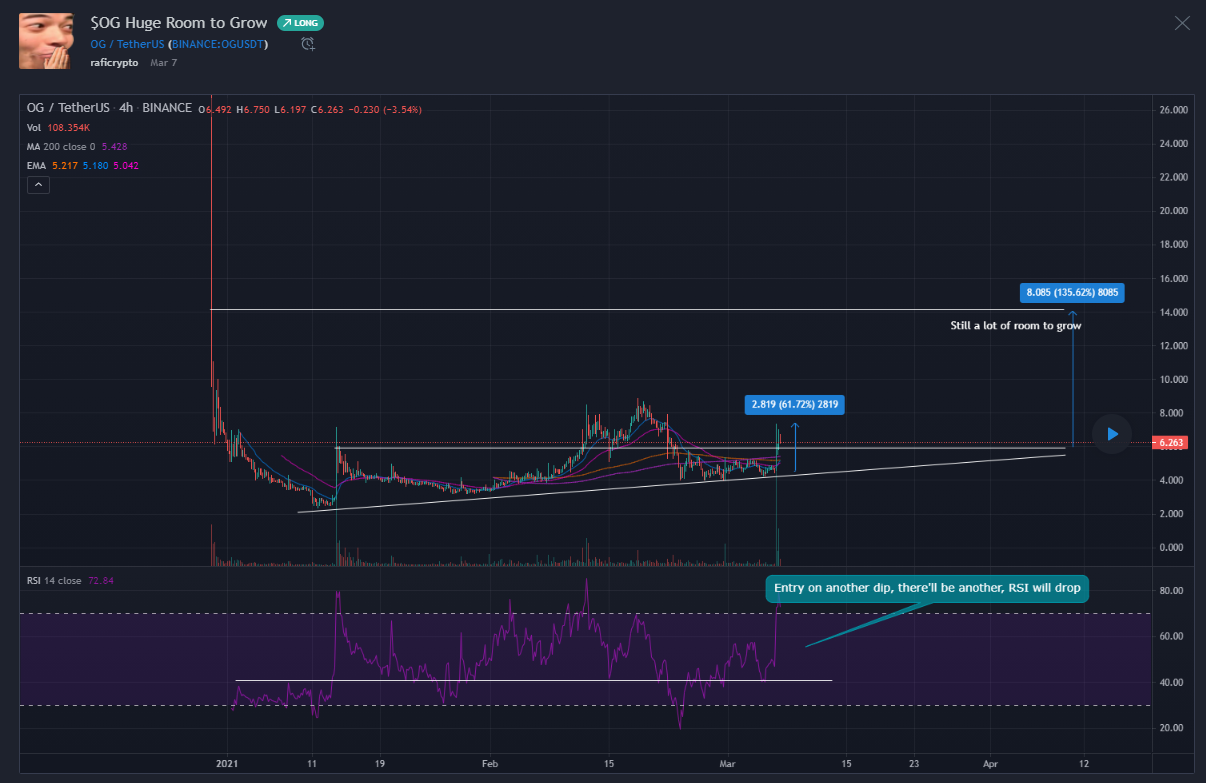
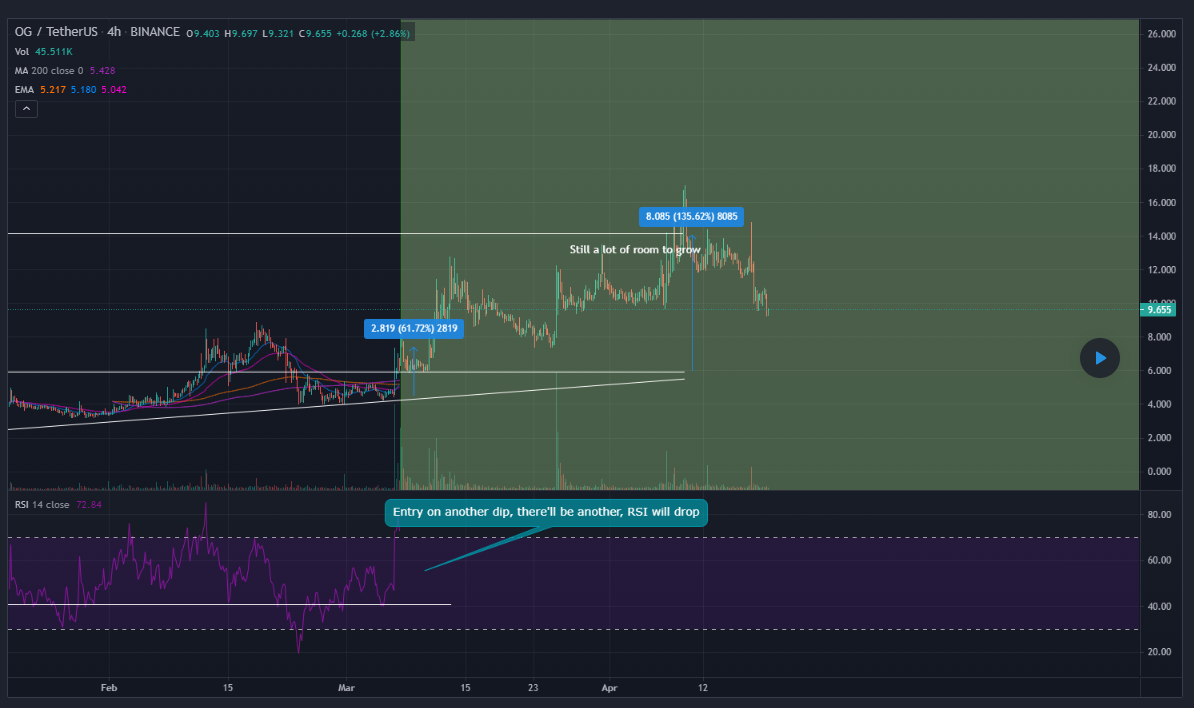
OG March 7th
3. High Risk
Usually in a bull market where resistance has been tested a couple of times, and you’re dead sure this time is the last time it test the resistance before finally flying to the moon. I do this setup relatively often in a bull market. depends on how strong the bullish momentum, especially using the daily chart. I provide a lot of examples below of how that setup looks like and the output of the trade.
Longing Resistance
Longing resistance is a reverse thing on the usual new traders, the usual mindset would to buy at support and sell at resistance, well which means that you still have a lot to learn, take a view on the example below


The reason why I made this trade, because There’s first a strong bullish momentum at $119 and days rally of the price, seeing BTC is on a strong momentum, these alts could just be more bullish especially if it manages to pass long past resistance and do a price discovery.
2nd Example
Longing an extremely bullish ascending triangle


Ok I believe now your mind is already blown after looking at that chart, and ask yourself, how the fuck longing resistance works? First, the one thing that most traders don’t have is patience. Notice that the chart above is a daily chart. That takes time, most of the traders I know, are impatient day traders that aim to get in and out of a trade every single day. Here’s the thing, you can miss out on that trade and couldn’t figure a good reentry because that’s literally VET last ascending triangle before lifting of treating the fib retracement as its new somewhat valid support.
First, you need to understand the bullish momentum, see how the charts and price rallies over time, and for how long. What causes the resistance and believe why this time the bursting through resistance will be different. How huge the ascending triangle will also matters.


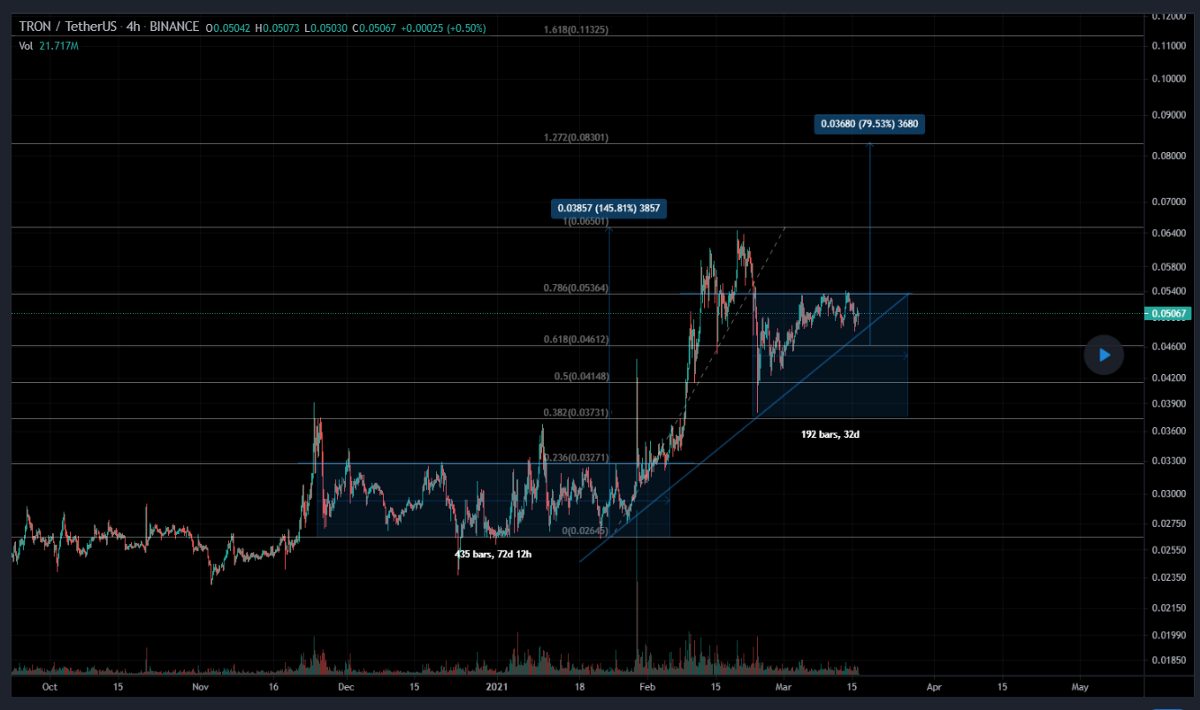
TRX March 16 Example
You also want to see how long the accumulation period is, on TRX it has a past consolidation and accumulation period of 72 days. then a bullish rally and rejected, in which the rejection resistance became my fib retracement top, then I analyze the uptrend support and draw the huge ascending triangle on TRX. Which leaves to a massive surge.

KSM March 17
This is a similar pattern on TRX, a long consolidation period, followed by an ascending triangle.
One thing you should notice is, this is a 4H chart, and this process takes a lot of time and relatively rare, occur in a macrocycle, so don’t mess it up when you see this happen again.


ETC March 16
This is again another great example, the most interesting thing about this chart is how far the past resistance is, a strong resistance if broken could lead to a massive surge.
I also take into account how bullish the RSI is, and it’s not only bullish in a short term but has been bullish in the very long term. That’s an amazing sign.
Also on how long the consolidation period. I feel like I’m repeating myself in this article but I think it's still important to point that out


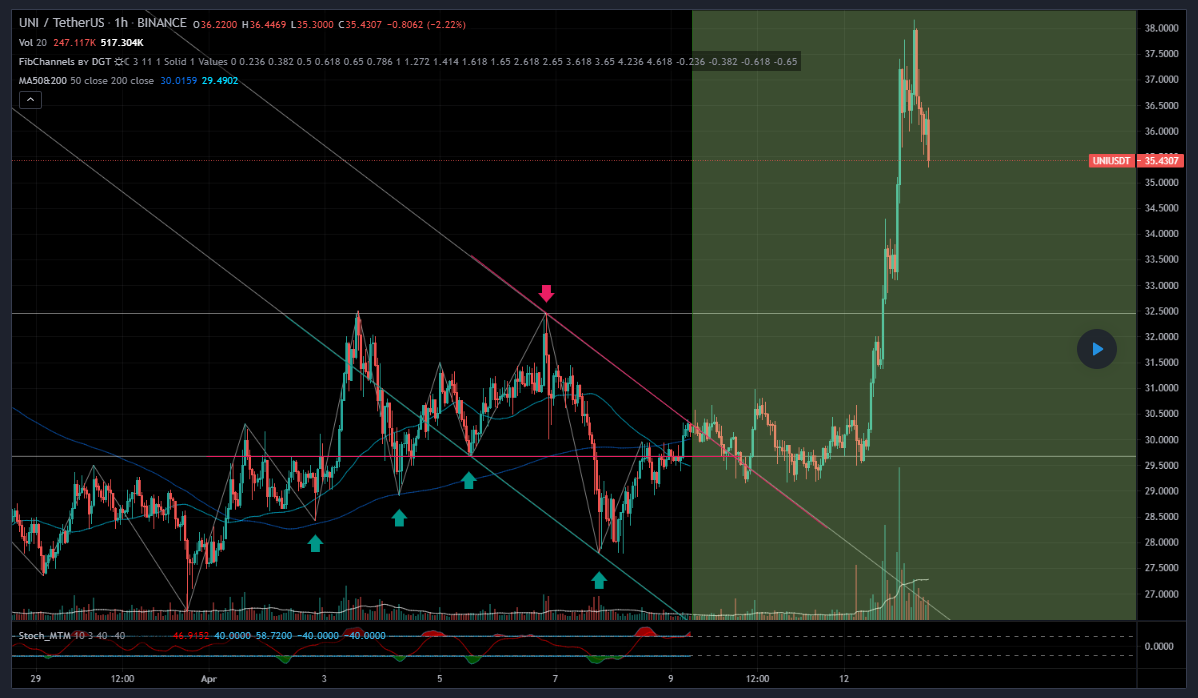
UNI APRIL 9
UNI shows a a resistance based on the fib channels, MAs are narrowing to a bullish descending triangle breakout. I believe it would break here, turns out its only a small break and then it goes to the retest and consolidates for a while before finally launching.
This is an example of a failure in longing the resistance, but my support is still valid and I still see a bullish momentum on the chart so there's not much reason to exit the trade, after all, this is an one hour timeframe chart.

EOS March 20
Great bullish RSI, high volume and currently dropping, and a huge ascending triangle. Pretty similar on what i've explained before I think.
Oh and on this trade notice on how I put a stop loss but the price quickly rebounced? Yeah unlucky, that means that the ascending triangle is still in play and the break down is a fake out.


KNC March 4th
This chart is pretty similar on the previous example, same reason also.
Check volume, check bullish momentum, how long has it been sustained and how far the price goes ini increase, and look at that they also form an ascending triangle. More reason to long at the resistance!


OGN March 4th
So looking at the previous historical pattern, it forms a double top that leads to a price drop by 75%, price bounced off a previous support and tumbling down to form a double bottom and that's where the bull momentum really starts. Price currently on retesting resistance again, what do?
Yes yes, I know longing resistance seems like a crazy idea but see what happened. This is exactly why I put longing resistance in the high risk category, but you would hate yourself for not entering this setup, that's my job to help you understand.
First take a look at the period of the bearish wave and how fast the bullish wave is, it's approximately from how I see is, at least 3x faster, so theres no sign of exhaustion, after all this is the third time they want to retest the resistance.
Check the volume and how massive OGN surges in attention, the recent surge in volume gives away a sign that the bull momentum won't leave any time soon and longing the resistance becomes the right thing.
On the call the price is at 0.492, the current price for OGN at the time of this writing is 2.0779, that's a 4x increase from longing a resistance!


Rationalizing
Psychological wise
Buying blood (dips or red candles) seems like a bad idea because, in a simple way, you’re aiming for something that just drops, what makes it wouldn’t drop even more? Here’s a context of “discounted price.” If the price has just decreased 30% and nearing strong support and you believe this is as low as it can go, just buy it. Set a stop loss below the strong support you assumed. The reason why this is a hard thing to do because you are being the early believer. Some people prefer to follow the herd and get in when it has shown a bullish reversal. However, it's safer to actually enter at the support when you buy blood, SL range-wise.
Buying retest seems like a rational idea because you have more clue on what's going on and where the reversal point would likely occur, you understand the bigger picture of what’s going on and be more brave on taking the decision.
Longing resistance seems like a mildly good idea, some people might be too fearful of long resistance because, in the track record, it's the line where it usually has a reversal, but sometimes the last resistance is really the difference between the trade setup from price discovery.
Advice
Trade the big trend.
Trade the big trend means being patient and wait for the right setup even though it takes time to form. There’s macrocycle and microcycle, microcycle means breakout at 15M candle, small stuff, fast in and out. Macrocycle means understanding the chart on the daily, weekly, monthly pattern, the long bearish wave, consolidation period, and huge ascending triangle setup. Remember that one good trade can make you don’t have to do another trade for months, and that’s the big goal you want to achieve and don’t want to miss out on.
I hope you learn from this article and if you feel there's any question you still want to ask, feel free to ask me through Instagram, @rafiamjad.
Best Regards,
Rafi Amjadrasyid